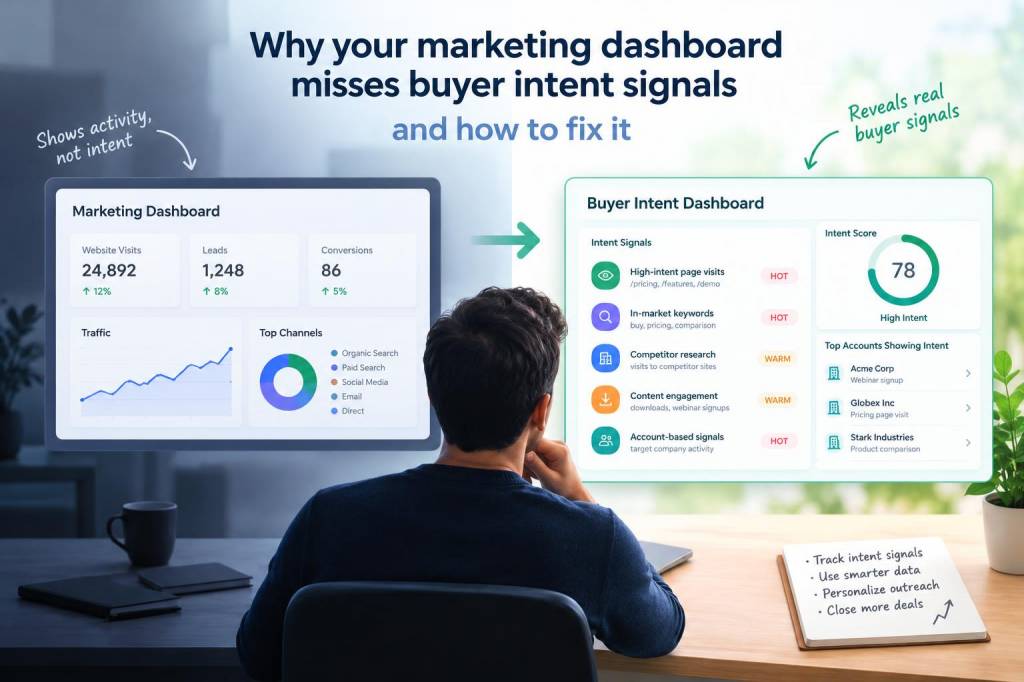
I have seen too many marketing dashboards that look impressive on a screen and still fail to answer the question that matters most: who is ready to buy, and who is only browsing? That gap is expensive. It leads to inflated lead counts, weak pipeline quality, wasted ad spend, and teams celebrating activity instead of revenue. When I review marketing performance, I rarely find a lack of data. I usually find a lack of buyer intent interpretation.
Intent signals are everywhere, but many dashboards flatten them into generic metrics. A page view becomes a page view. A form fill becomes a form fill. A webinar registration gets treated like a deal opportunity. In reality, each action carries different meaning depending on timing, sequence, content, and depth. A buyer who visits a pricing page three times in a week is not behaving like someone who opened a newsletter once and left. Yet many reporting systems place both people in nearly identical buckets.
Why standard dashboards hide buyer intent
Most dashboards are built around convenience, not decision-making. They collect traffic, sessions, clicks, conversions, and cost data, then arrange everything into neat charts. That structure is useful for surface-level tracking, but it often misses context. Buyer intent is not a single event. It is a pattern.
When I see a dashboard missing intent signals, it usually means one or more of these problems is present:
That last point matters a lot. A dashboard might tell me that paid search drove 40 percent of leads, but it does not tell me whether those leads were deeply engaged or simply low-friction conversions from a broad query. If I only look at source-level reporting, I can easily mistake traffic quality for purchase readiness.
What buyer intent really looks like
I define buyer intent as a combination of behavior, relevance, and timing. A person signals intent when they repeatedly interact with content, products, or pricing in a way that suggests movement toward a decision. One action can matter, but intent usually becomes visible through repetition and sequence.
For example, I pay close attention to combinations like these:
Those signals are often stronger than a generic conversion. A downloadable checklist may look like a success inside a dashboard, but if it never leads to deeper engagement, it may not represent real demand. I prefer to ask a harder question: did this behavior indicate curiosity, or did it indicate movement?
Why leads and intent are not identical
One of the biggest mistakes I see is treating a lead as proof of intent. A lead is only a contact record with some level of engagement. Intent is more specific. It tells me whether a person or account is actively evaluating a solution.
This distinction matters because many dashboards reward lead volume. That makes teams optimize for easy conversions, such as gated content or broad offers, even when those leads have little chance of becoming customers. I have seen campaigns with excellent cost per lead numbers but poor revenue performance. On paper, they looked efficient. In practice, they created noise.
To fix that, I try to separate capture metrics from purchase indicators. Capture metrics tell me who gave me a name. Purchase indicators tell me who is moving closer to a decision. Both matter, but they should never carry equal weight.
Signals I add to dashboards when I want better answers
Once I stop relying only on top-line conversion data, I can build a much more useful view of demand. I like to include signals that show depth, recency, and progression.
| Signal | What it suggests | Why it matters |
| Pricing page revisit | Evaluation behavior | Often indicates active comparison or budget review |
| Multiple high-intent page views | Strong research pattern | Shows movement beyond casual browsing |
| Short time between sessions | Rising urgency | Can signal a tighter decision window |
| Sales content engagement | Decision-stage interest | Useful for prioritizing follow-up |
| Account-level multi-user activity | Broader internal evaluation | Often stronger than a single-user interaction |
| Trial or demo completion | Hands-on intent | Shows willingness to invest time in evaluation |
I also like to track the sequence of behavior. Someone who lands on a blog post, reads a comparison page, then checks pricing is different from someone who only consumes educational content. Sequence gives me context. Context turns data into insight.
Why intent gets missed inside attribution models
Attribution often makes intent harder to see because it forces behavior into a single credit model. First-touch, last-touch, and linear attribution each tell part of a story, but none of them fully describe buying motivation. If a buyer spends time researching over multiple sessions, the real signal may be buried under channel credit disputes.
I have learned not to ask only which channel produced the conversion. I also ask which content or touchpoint accelerated decision-making. That distinction is crucial. A thought leadership article may not close the sale directly, but it may introduce the problem. A comparison page may not create demand, but it can reveal that demand already exists.
When dashboards over-assign credit to acquisition channels, they can make upper-funnel activity look more valuable than it is. That may encourage more broad reach campaigns even when the business really needs stronger intent capture and nurturing.
How I fix the dashboard structure
If I want a dashboard to reflect buyer intent, I start by redesigning what it measures and how it groups behavior. I do not remove standard metrics. I layer intent on top of them.
My approach usually includes these changes:
I also recommend building a dashboard that answers three direct questions: Who is showing intent? What behavior is increasing intent? Which campaigns attract real buyers, not just traffic? Once those questions are visible, reporting becomes more strategic and less decorative.
Why sales and marketing must share one interpretation of intent
Marketing teams often define engagement one way, while sales teams interpret it another way. That split creates frustration. Marketing may hand over leads that look warm in a dashboard but feel cold in a sales conversation. Sales may dismiss digital behavior that actually shows valuable research activity. Neither side is wrong; they are just using different definitions.
I have found that a shared intent framework solves a lot of this tension. When both teams agree on which behaviors matter most, follow-up becomes faster and more relevant. Sales can prioritize accounts with multiple high-intent actions, while marketing can nurture lower-intent audiences with more appropriate content. Everyone works from the same map.
This shared view also improves reporting discipline. Instead of asking, “How many leads did we get?” I can ask, “How many leads showed meaningful buying behavior, and how many converted into revenue?” That question creates better decisions immediately.
What I watch for in a healthy intent dashboard
A strong intent dashboard does not just show more data. It shows better data in a clearer sequence. When I review one, I want to see evidence of quality, not noise.
I also like dashboards that make weak signals visible without overreacting to them. Not every spike means buying interest. Sometimes a spike is caused by internal research, media coverage, or even a bot. Strong reporting includes validation, not blind excitement.
For me, fixing a dashboard is not about adding more charts. It is about removing false certainty. Once I stop treating every action as equal, I can finally see which behaviors deserve attention, which campaigns attract serious demand, and which users are quietly telling me they are ready for a conversation.