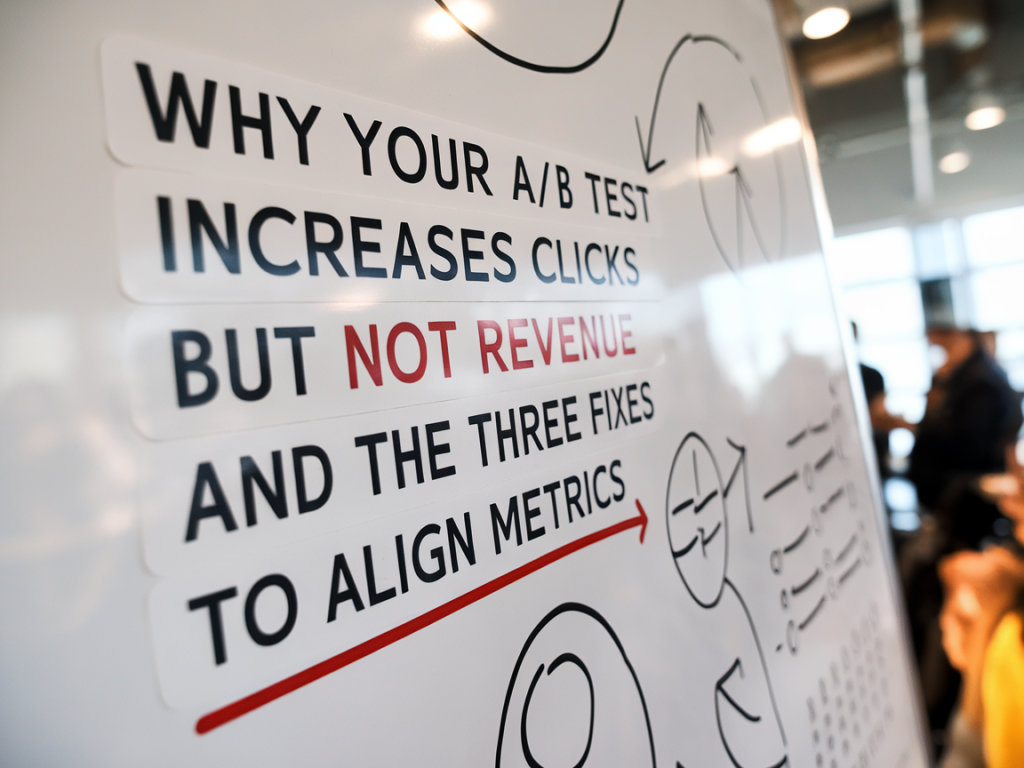
I run Market Research (https://www.market-research.uk), and over the years I've seen the same A/B test pattern repeat across startups and enterprise brands: a variant wins by increasing clicks or engagement, the team celebrates, and revenue... flatlines. If you're scratching your head about why higher click-through rates (CTR) aren't translating into higher revenue, you're not alone. In this article I walk through the common reasons this disconnect happens and share three practical fixes I’ve used with clients to align engagement metrics with revenue outcomes.
Why clicks and revenue diverge
Clicks are a surface-level indicator. They tell you whether a page or creative is compelling enough to get attention. Revenue, on the other hand, is downstream — built from conversion rate, average order value (AOV), purchase frequency, retention, and attribution. Improving the front door (clicks) doesn't guarantee the customers walking through it will buy more, buy now, or buy again.
Here are the most common reasons I see for the disconnect:
Three fixes to align clicks with revenue
When I audit tests, I look for solutions across design, analytics, and product. Below are three fixes I use repeatedly. Implement them together—each one amplifies the others.
Before you test, ask: what outcome matters most to the business in the next X days? If revenue or LTV is the goal, make the primary metric reflect that. For example:
| Business Goal | Recommended Primary Metric | Why it helps |
|---|---|---|
| Immediate sales | Revenue per visitor (RPV) over 7–14 days | Combines conversion rate and AOV into one business-focused metric |
| Subscription growth | Net new subscribers after trial period | Captures trial-to-paid conversion instead of initial clicks |
| Long-term value | 30–90 day cohort LTV | Measures real value of customers, not just first interaction |
I've seen teams run tests with CTR as the primary KPI, celebrate a winner, and only later realize the variant reduced AOV by 12%. Had they used RPV or short-window revenue as primary, they would have caught the trade-off immediately.
An inspiring subject line or hero image that drives clicks can also set expectations. If the landing page doesn't deliver what the ad promises, people bounce, or worse, buy a cheaper product. Two practical steps I've used:
Example: A client increased CTR by 25% using a playful creative that emphasized “free demo.” But the demo required scheduling and a 2-week onboarding call — a friction mismatch. Updating the page to offer an immediate interactive product tour increased trial signups and, crucially, paid conversions.
Clicks aggregate everyone. Revenue is sensitive to who clicked. If a variant attracts lower-value segments (new browsers, traffic from deal sites), overall revenue can stagnate. To address this, I do three things:
On one engagement, a headline change boosted clicks among new visitors but reduced return visits from existing customers. Segmenting by new vs. returning visitors showed a 20% drop in average order value for returning customers and helped us revert or tailor messaging by audience.
Statistical and operational guardrails
Beyond these fixes, some technical and operational practices prevent misleading wins:
Practical playbook you can use today
When you next run an A/B test that targets clicks, use this quick checklist I use with internal teams and clients:
One last practical tip: if your organization is small and can’t wait for long revenue windows, use bolstered proxies. For example, high-intent micro-conversions (adding to cart, starting checkout, scheduling a demo) can stand in for revenue early in the funnel—if you validate their correlation to revenue historically. I helped a DTC brand map add-to-cart to 14-day revenue and used that proxy to iterate quickly; once we had a stable winner on the proxy, we confirmed it with full revenue measurement.
Aligning clicks with revenue is both a measurement and product-design challenge. It requires the right metrics, better funnel thinking, and disciplined segmentation. When you treat clicks as an early signal rather than the end goal and build tests that account for downstream behavior, you’ll find fewer hollow wins and more changes that actually grow the business.